Top Pair Candidate Decaying Into an Electron + Neutrino (from W) + 4 Jets
Here, we have the events display of an event which is a candidate of a pair of Top quarks decaying into a pair of W Bosons(one of the 3 Intermediate Vector boson which carries the force of the weak interaction, which causes such phenomenom as radiative decays) + 2 B jets. One of the W which subsequently decays into an electron and a neutrino (which escapes our detector without interaction, and thus is observed by as MET (Missing E Transverse) in the event--while the other W decays into 2 jets (either u + d-bar or c + s-bar), leading to a total of 4 jets (2 of which are b-jets) + electron + neutrino.
For a introduction to the CDF event displays, see the event display below
and the explanation at the bottom of this web page
The lower left figure shows the end-view of the tracking system along with the calorimetry, indicating a stiff track at 8 o'clock (one that shows almost no bending, and thus is measured to have a very high Momentum of about 40 GeV). That track, which does not have other high energy tracks nearby (we call this "isolated" track) also points directly to an energy deposit in the EM ealorimetry consistant with the track momentum measured-- thus confirming that this is a good electron candidate.
The same events also have 4 jets--2 of these jets (jet # 1 at 2:30 and jet # 4 at 4:30 directions) each have a secondary vertex unpon close examination of the tracks near the collision vertex (which we can do only because of the superb accuracy of track determination by the SVX track detectors)--see the close up on the lower right. These secondary vertices--with liftime consistant with a B meson decay-- indicate strongly that these 2 jets are good candidates for b jets.
Thus, this event is a good candidate for the physics process described in the picture at right (except that we have an electron and an electron neutrino instead).
Explanation of the Event Displays
3 sets of event displays provides a graphic image of the event and is useful to "see" what is happening in the event. We use it as a tool to understand the event, but people outside of CDF would also get a better feeling of what a CDF event and detector looks like.
Let me list the 3 sets of CDF event displays:
- Beam (or end-on) view, looking into the solenoid--with tracking (COT, SVX) info along with the central calorimetry and Muon chambers
- Lego plot --a view of the energy deposited into the EM (in red) and Hadron (in Blue) calorimetries.
- Close up of the SVX detector --showing secondary vertices
Now for some details:
- Beam view -- (see the figure at left above). The reconstructed tracks
in the COT tracker (3 m in diameter) are shown, with
Isolated stiff track (very little bending indicated very high momentem) oftens indicates an electron candidate (if accompanied by an EM calorimeter energy deposit consistant with the track momentum, as is the case of the electron candidate at 8 o'clock above).
Other isolated still tracks with very little energy deposite but with hits in the outer muon chamber (outside of the picture above) are muon candidate Muon + neutrino for an example of the expanded Beam view (diameter roughly 10 meters) -->
Groups of high and low energy tracks indicates a jet--see the 4 jets displayed above--these usually points to energy deposite in both the EM and HAD calorimetries.
Note that the beam view only displays the Central calorimetry--which goes from roughly 30 degrees to 90 degrees from the beam. Energy deposited in the Plug (roughly 10 to 30 degrees) are not shown-- as indicated by jet 4 above, which pointes to a track--you do see the energy deposited in the logo plot described below.
Note also that occasionally, 2 jets/isolated-track could overlap in Phi (the axumuthal angles, which goes from 0 degrees at 3 o'clock, to 90/180/270 degrees at (6/9/12 o'clock))--so occasionally it may be difficult to separate the 2 items in this view--the lego plot is better.
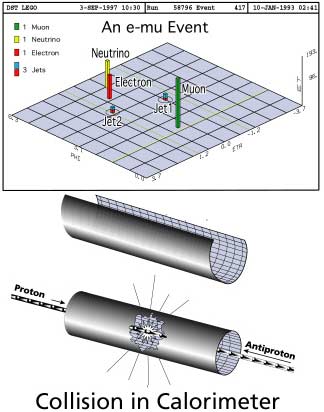
- Lego plot of Energy flow--The central calorimeter is a cylinder
of calorimetry towers (pointing to the interaction point) just outside
the solenoid magnet. There are 2 layers--the front EM calorimeter usually
display in red (which record almost all the EM showers for electrons and
photons), and the back hadron calorimeter energies usually displayed
in blue (which will record most of the hadronic showers from
charged pions, kaons, protons and neutrons.
displaying this "cylinder" of energy flow in 2 dimension is difficult-- so, we "unroll" the cylinder, and make it into a flat 2-d plot, with the magnitude of the towers being the total energy deposited. The figure at the right shows such a process of un-folding.
The scale of this plot require some explanation--one of the dimension is the Phi, or Azumuthal angle. In the CDF convention, 3 o'clock is 0 degrees (or 0 radians), and 6/9/12 o'clock are 90/180/270 degrees (or pi/2, pi, and 1-1/2 pi radians).
The other dimension we jus is call Eta (or Psuedo-rapidity). Eta of 0 is 90 degrees to the beam (perpendicular to the entering beam), and Eta of +1/-1, +2/-2, +3/-3 corresponds to 140/40 degrees, 165/15 degrees, and 174/6 degrees to the beam. - SVX close-up plot-For an important class of event, we look for
"secondary vertices" very close to the interaction point. The top pair
event displayed at the top of this web page contains this SVX close-up
display at the bottom right--you can see that the scale is way down from
the usualy beam-view--instead of 3 meters, is now 5 mm, a facter of almost
1000 smaller.
The secondary vertices indicate that something produced at the interaction vertex has travalled several mm before decaying (note that this decay region is inside the vacuum pipe, so interaction of particles are unlikely--this is of cource not the case for the beam pipe--several centimeters from the interaction point, and probability of particles interacting in the beam pipe causing a secondary vertex is of order few tenths of a percent).
It turns out that a B meson, as well as a Charmed D meson, would fit as the source of this decaying particle. The lifetime of the B meson is about .0017 of a nanosecond.
Thus, if we select a sample of jets with secondary vertices inside the beam pipe, there would be strong candidates for B or D mesons.
This is important because many new physics processes preferentially decay into B mesons--one example is the Top quark, which, as far as we know, always decay into a b quark + a W boson.
The study of B mesons are also inherently intersting, such as lifetime, decay properties, etc. Thus, the ability to measure such short secondary vertices is an important feature of our detector, and we have spend a huge amount of effort to make this ability present--the SVX detector is one of the most challenging part of the CDF detector !!!
- Last modified
- 04/06/2022
- email Fermilab